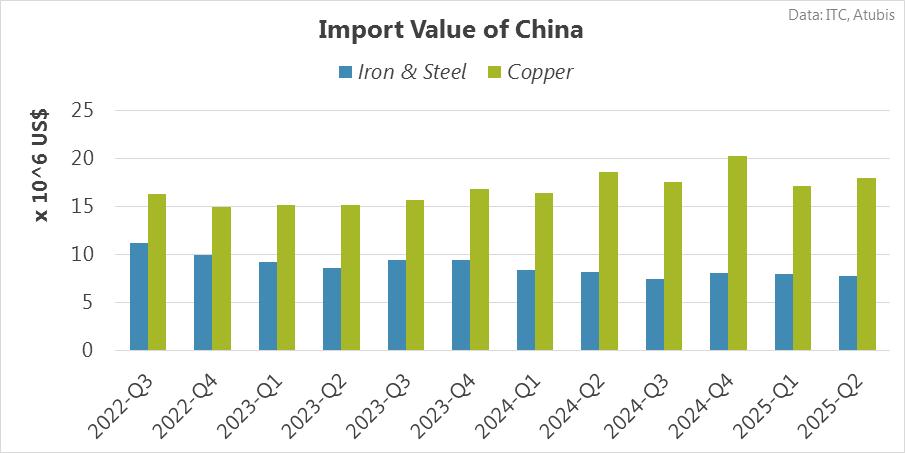
Between 2022-Q3 and 2025-Q2, the total import value of China’s Iron & Steel and China’s Copper moved in opposite directions, with a moderate inverse relationship. Iron & Steel imports declined gradually, posting a negative CAGR of -3.3% and falling from about USD 11.2 million to USD 7.76 million by 2025-Q2. Copper imports, however, increased slightly over the same period, with a CAGR of 0.9%, reaching roughly USD 18.0 million. On a year-on-year basis in 2025-Q2, both categories recorded declines, though the drop was sharper for Iron & Steel than for Copper. Trend analysis shows that Iron & Steel followed a slightly downward path, while Copper maintained a slightly upward path, and both exhibited low and limited volatility throughout the initial, middle, and closing periods.
Between 2022-Q3 and 2025-Q2, both the ratio of Iron Ore to total imports of China’s Iron & Steel chain and the ratio of Copper Concentrate to total imports of China’s Copper chain showed limited volatility, meaning their movements stayed within a relatively controlled range. Despite this, both ratios increased overall, though at different speeds. The Iron Ore ratio rose much more strongly, climbing from about 283% to nearly 379%, while the Copper Concentrate ratio increased more moderately, moving from roughly 83% to around 114%.
Looking at their relationship, the two ratios had a moderate correlation and generally moved in the same direction over the period. Trend analysis shows that the Iron Ore ratio followed a slightly upward path with low volatility through most of the period, before shifting to a slightly downward trend in the closing period. Its final level in 2025-Q2 was lower than the year before, but this outcome was not unexpected when compared with earlier quarters.
In contrast, the Copper Concentrate ratio displayed a more mixed pattern. After a slightly upward trend in the initial period, it moved into slightly downward trends during the middle periods, before returning to a slightly upward trend in the closing period, again with low volatility throughout. Its final level in 2025-Q2 was higher year-on-year and considered almost unexpected, given the behavior seen in previous quarters.
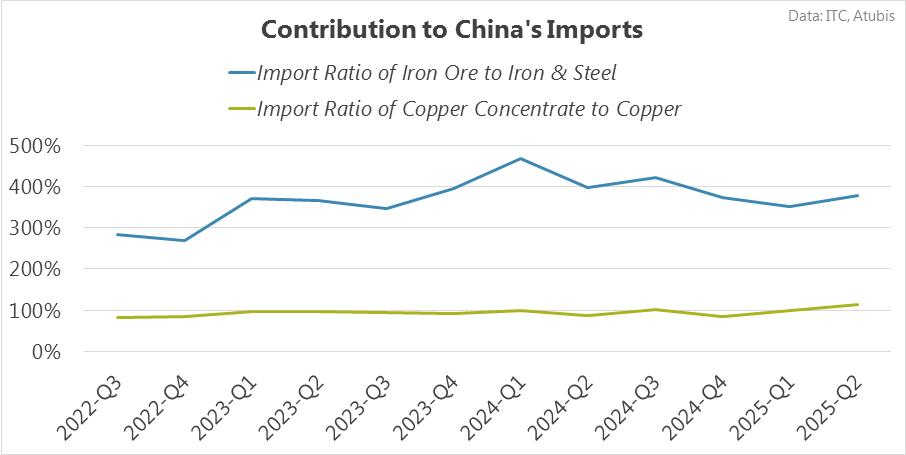
Over the last 12 quarters, Iron Ore has clearly played a more important role in the total imports of China’s Iron & Steel chain than Copper Concentrate has in the total imports of China’s Copper chain. This relative position remained unchanged throughout the period, with Iron Ore consistently holding a higher position than Copper Concentrate. On average, Iron Ore accounted for about 372.4% of total Iron & Steel chain imports, while Copper Concentrate made up roughly 96.0% of total Copper chain imports, highlighting the stronger role of Iron Ore. In addition, between 2022-Q3 and 2025-Q2, there were more quarters in which Iron Ore ranked higher in its import chain than quarters in which Copper Concentrate ranked higher in the Copper chain. Taken together, these patterns confirm that Iron Ore maintained a more prominent and effective role in China’s Iron & Steel import structure compared with the role of Copper Concentrate in the Copper import chain.