Generally, the per capita consumption trend of refined zinc, lead, and copper has been increasing in 2002-22. The refined lead and zinc per capita consumption decreased by 1.1% and 5.3% respectively in 2009 due to the 2008 financial crisis beginning.
Refined copper per capita consumption faced a 0.9% drop in 2009. Although, zinc consumption decreased in the USA in view of the financial crisis, the increase in China’s consumption compensated for this drop. Also, the per capita consumption of copper decreased along with the higher growth of population than copper consumption growth. Because of the EU Debt Crisis, lead and zinc per capita consumption decreased, but copper per capita consumption was not affected vastly by it due to the fact that the largest copper producers and consumers are in America and Asia.
Copper is third most widely used metal in the world. This metal’s main applications are in the electrical wiring, roofing, piping and industrial machinery; for many of these applications, copper is used in its pure form. Anyway, if there’s a necessity to increase the hardness level, it’s alloyed with other metals. On ILZSG report basis, zinc and lead are the two widely used non-ferrous metals in the world after aluminum and copper.
Zinc usually used as a protective cover for other metals like steel and iron in order to prevent Corrosion. Moreover, Zinc is consumed in nickel, silver, brass and bronze alloys. The main application of lead is in the battery production in the automobile industry. Nowadays, there are various types of lead batteries in the market, their sealed types which are known as valve regulated in the market can be pointed as the most important type of these batteries which also have a longer lifespan compared to the old lead batteries. Another notable lead’s application can be named is its uses in the armored cables resistant to moisture and heat. This metal is also used in ammunition and bullet manufacturing.
4.9% drop in zinc per capita consumption in 2019
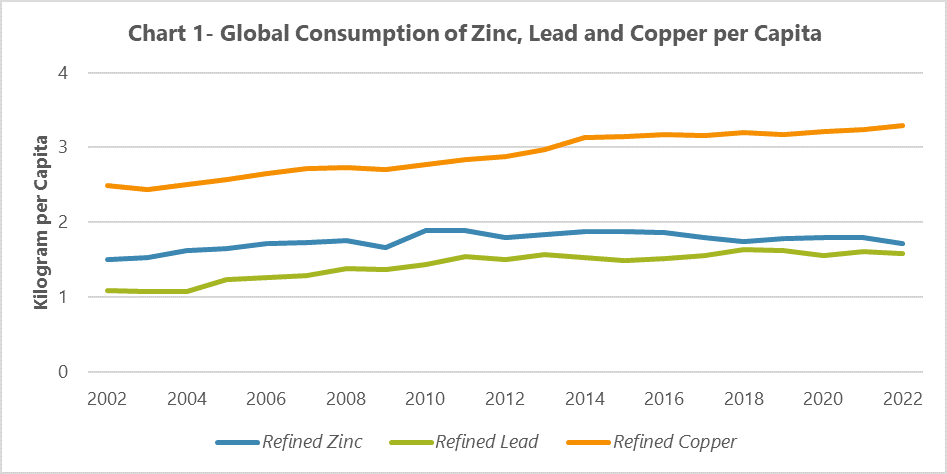
The figure 1 indicates the per capita consumption for world’s refined zinc, lead, and copper in 2002-22. As it’s shown the per capita consumption trend for refined zinc has been increasing over the course of this period and its per capita consumption CAGR was 0.6% all over the world in this frame time. In 2009, refined zinc per capita consumption decreased by 5.3% in comparison to the previous year. Aturpat’s surveys clarify that this drop in zinc per capita consumption was caused by the 2008 financial crisis which affected all the world’s markets.
With the beginning of the financial crisis, the consumption of refined zinc in the consumer markets decreased as well. Since 2010, after the improvement of conditions caused by financial crisis, refined zinc per capita consumption grew by 12.9% and then it dropped by 4.9% in 2012. Our investigations show that the EU debt crisis in 2012 impressed the world’s refined zinc consumption. Zinc per capita consumption found a declining trend after 2015.
Based on the given statistics by ILZSG institute, due to China, Asia is accounted as the largest refined zinc consumer in the world. Considering the fact that half of refined zinc is consumed in China, this country has a great impact on the world’s refined zinc consumption. In 2015, China announced Made in China 2025 program as part of its industrial development strategy for mid-term to long-term. China encountered increase in labor cost and limitations of resource and environmental after fast development years. Since 2016, as China’s rapid growth in refined zinc consumption stopped, China’s per capita consumption also decreased with further population growth, and this led to a downward trend in global zinc per capita consumption. Zinc per capita consumption was 1.7kg in 2022 which decreased by 4.9% compared to 2021; one of this drop reason was the lack of growth in zinc consumption in the world.
Lead consumption resilience to the financial crisis
Overall, refined lead per capita consumption has been increasing in 2002-22; in a way that its CAGR in this period was around 1.9%. With the increasing speed of urbanization, the demand for SLI (lead batteries), backup batteries and also energy storage facilities increased, the use of refined lead metal also increased so that in 2002-12 the CAGR of lead per capita consumption was about 3.4%. Per capita consumption of lead decreased by 1.1% in 2009 compared to the previous year. Our surveys show the 2008 financial crisis impact on this drop. Also, in 2012, refined lead consumption declined by 1.8%. One of the reasons was the EU Debt Crisis. The per capita consumption of refined lead compared to the per capita consumption of zinc was resilient to financial crises and did not face a significant drop and one of this matter’s reasons was the wide applications of lead in batteries due to the low price of lead-acid batteries, it wasn’t found any substitute for it.
Digitization, increased access to information, has brought about a revolution in research, development, construction and all aspects of life and how society is managed. In order to adapt to the new changes, the major industrialized countries presented development strategies to change their production capabilities. In 2011, the USA launched the Smart Manufacturing Initiative with the goal of bringing manufacturing capabilities back to the United States. In 2013, Germany launched its manufacturing initiative with the aim of enhancing Germany’s industrial capability through digital transformation.
In 2014, England launched a coherent strategy for remanufacturing across the UK, proposing the concept of future manufacturing and establishing research institutes in the field. In 2015, China announced its Make China 2025 plan. In general, the requirement for further development of the non-ferrous metal sector is green production. By 2025, energy consumption per industrial value-added unit should be reduced by 34% compared to 2015.
CO2 emissions per unit of value-added industrial must be reduced by 40%. Non-ferrous metal companies, including lead and zinc smelting and refining operations came under close scrutiny, leading to higher operating costs and the need for cleaner raw materials when importing ores and concentrates. For this reason, in 2015-22, the per capita consumption of refined lead increased with a lower slope compared to previous years.
6% drop of copper consumption in the USA
Refined cooper per capita consumption had an uptrend in 2002-22. Its CAGR was about 1.4% at the same time. In 2008, per capita consumption of refined copper recorded a decrease of about 0.9% compared to the last year. Due to the 2008 financial crisis, consumption of refined copper in the United States fell by about 6% to the lowest level in more than 20 years. According to the US Bureau of Metals Statistics, in addition to weakness in the housing market, the copper tube market was affected by the continued substitution of plastic. However, the growth of refined copper consumption in China compensated for the decrease in consumption in America, Europe and other regions, and the consumption of refined copper increased in 2008, but its growth was lower than the population growth in the world. In 2022, the per capita consumption of refined copper was about 3.3kg, which increased by about 2.0% compared to 2021.